
THE HISTORY
BEHIND VISUALIZATION MANAGEMENT™
Harry Beck’s solution illustrates a central idea of Visualization Management™:
Make complexity understandable without losing what matters.
Early London Underground maps attempted to represent the network geographically. Although accurate, the growing number of lines and stations made them increasingly difficult to understand.
In 1931, electrical draughtsman Henry Charles “Harry” Beck developed a radically different approach. Inspired by electrical circuit diagrams, he reduced geographical accuracy and focused on what passengers actually needed:
- lines and connections
- station sequences
- interchange points
- clear orientation
Using horizontal, vertical and 45-degree lines, Beck transformed a complex transport network into a clear and practical visual structure. His diagrammatic Tube map was first published in 1933 and became a model for transport maps around the world.
THE PRINCIPLE FOR VISUALIZATION MANAGEMENT™
A visualization does not have to reproduce every detail of reality. It must preserve the relationships and information required for understanding and decision-making.
This approach provides:
- as much overview as possible
- as much detail as necessary
- additional information when required
- a shared picture for different participants
Complexity is not simply removed.
It is structured in layers—opening detail when needed and reducing it when overview matters.
WHAT OUR
VISUALIZATION MANAGEMENT™ DELIVERS
CORE IMPACTS
- A shared understanding among customers, teams, suppliers and management
- A shared view of the current state and target state
- Visibility of timelines, buffers, bottlenecks and dependencies
- A common basis for discussions and decisions
- Support for the continuous improvement process
ADDITIONAL PRACTICAL BENEFITS
- Easy maintenance with familiar tools such as PowerPoint
- Fast updates based on lessons learned and changing project conditions
- Reusable materials for training and onboarding
- Knowledge remains traceable and accessible to new participants
A LIVING MANAGEMENT FOUNDATION
A visualization becomes a living foundation for collaboration, decision-making and knowledge sharing.
VISUALIZATION MANAGEMENT™
IN PRACTICE
An anonymized practical example showing how process analysis, clear responsibilities, structured activities and measurable KPIs create a shared roadmap for project stabilization.
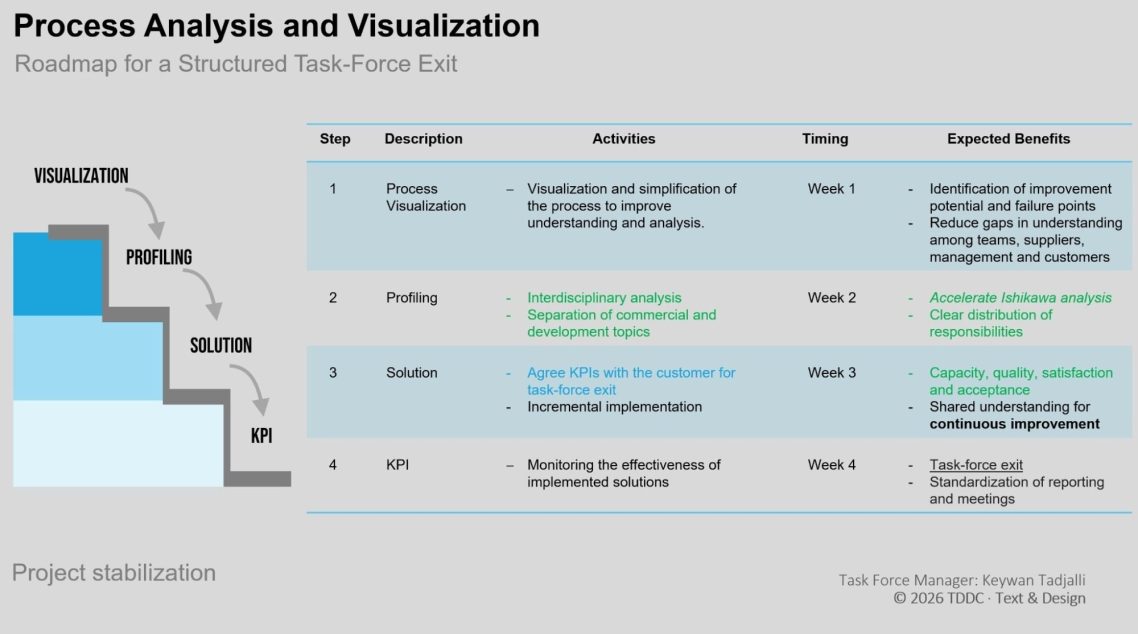
This enables a structured exit from a costly task force within a defined and manageable timeframe.